Under the Performance section, you can access your student's Data Dashboards. Dashboards will display charts related to your student's courses, assessments, and any additional data provided. All charts are drillable and allow you to see more information by clicking into them.
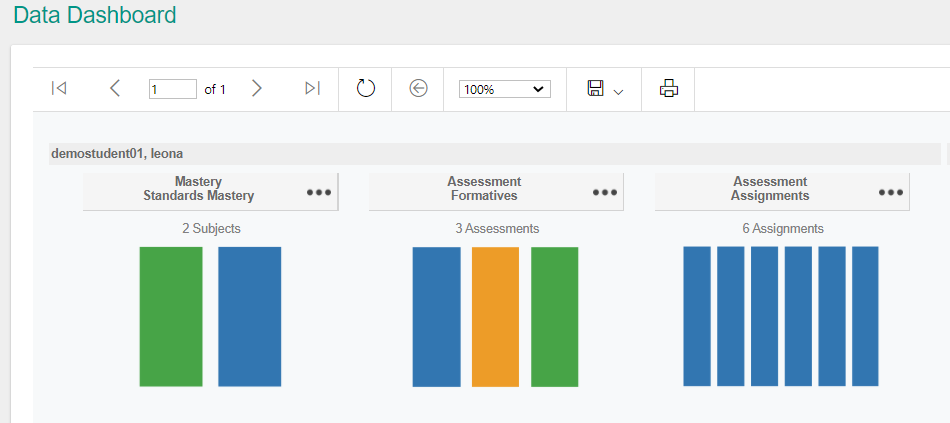
All report tiles give you the option to go deeper into the information displayed.
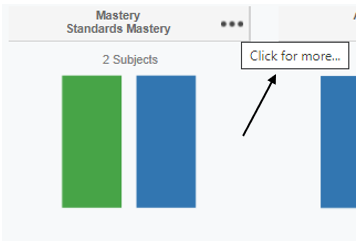
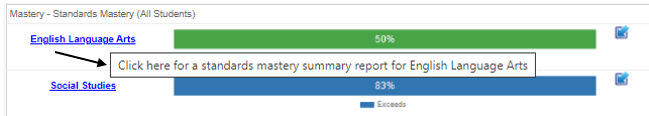
Once you have clicked into a report, you will see more granular information focused on the information provided. Any time you see a blue underlined title or you hover over a graphic and receive a pop-up like the one below, this means you can continue to go deeper into the report.
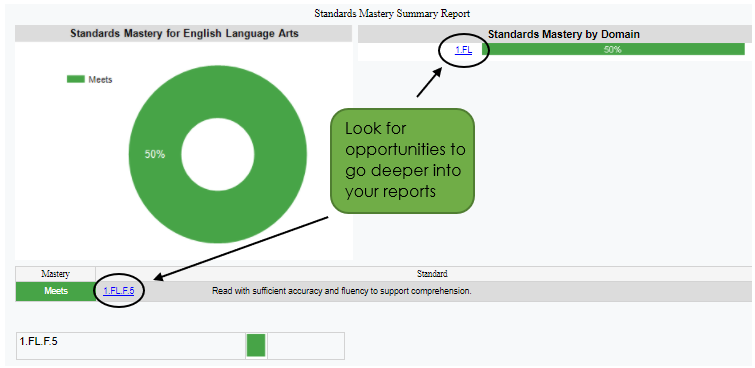
Each time you go to a new layer of the report, you may see opportunities to explore the data and performance in a new view.
Comments
0 comments
Please sign in to leave a comment.