Let’s take a closer look at the Standards Mastery dashboard. When drilling down, you will see all data organized by sections. For every section, you will see color-coded student performance by subject (colors and color titles can be customized). Data can be filtered by School, Grade, Students, Gender, Race, ELL and SWO. Clicking on the filter will expand the data accordingly. You can view more data by clicking on a subject hyperlink for one of their sections.
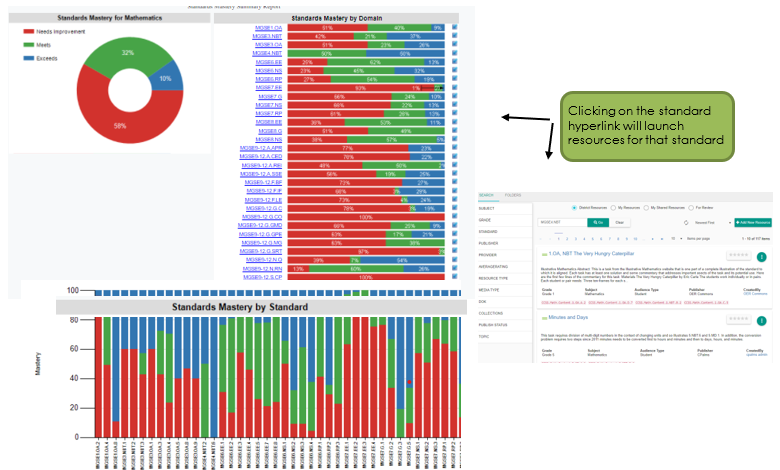
Here, teachers will see color-coded performance by domain and by standard. Selecting the hyperlink standard will bring you to Resources for that standard. Selecting a color on the color-coded performance bar will you bring you to a roster of all students performing in that band. Selecting a student from the roster will bring up all data dashboards for that specific student.
Comments
0 comments
Please sign in to leave a comment.